Firstly we focuses on the basics of graphic design. These include colour theory and colour systems, image formats (e.g., vector and pixel format) and typography. Furthermore, we will get to the bottom of modern graphic design and break it down to the basic concepts. The goal is to learn how to apply these concepts to your daily life as a scientist.
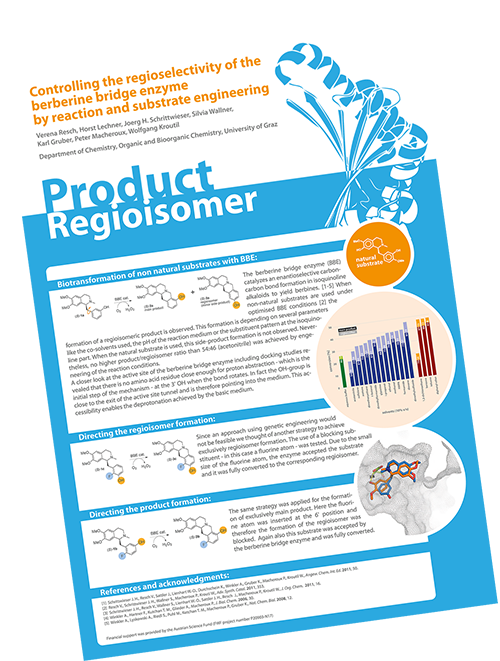
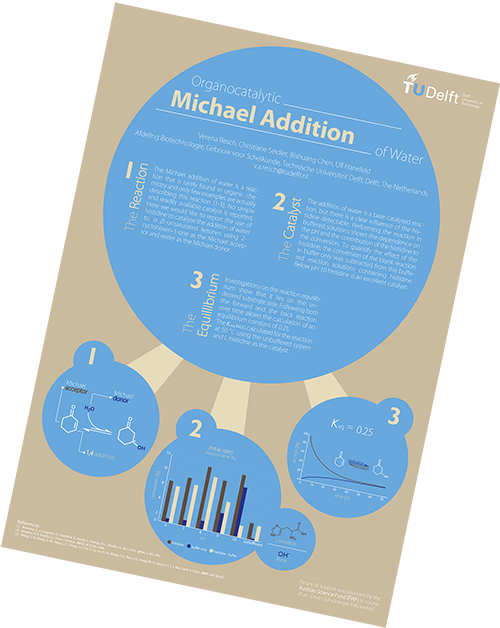
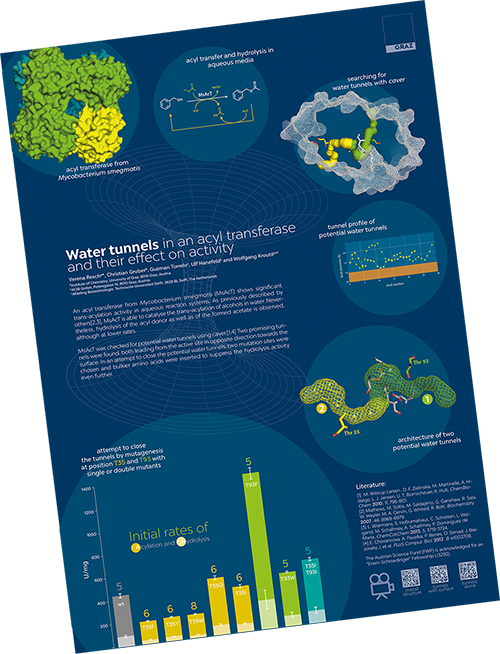
After talking about the basics ww aims for creating stunning scientific presentations and posters for conferences and meetings. Starting with reviewing the current standards in scientific poster and presentation design we will give you an outlook on what scientific artwork can look like and how to get there. Continuing with different concepts for planning your presentation or poster we will finally immerge into the topics of storytelling and how to attract visitors to your poster. If desired, posters or presentations from participants will be reviewed with the previously defined criteria in mind.
After learning about the basic, the data module is aiming at the use of the newly gathered knowledge to effectively present your data. We talk about visual perception and what to consider when preparing data for a publication, a talk or a poster how to choose the best format. The visualisation of big data will also be discussed and how data can be integrated in the story of your presentation.
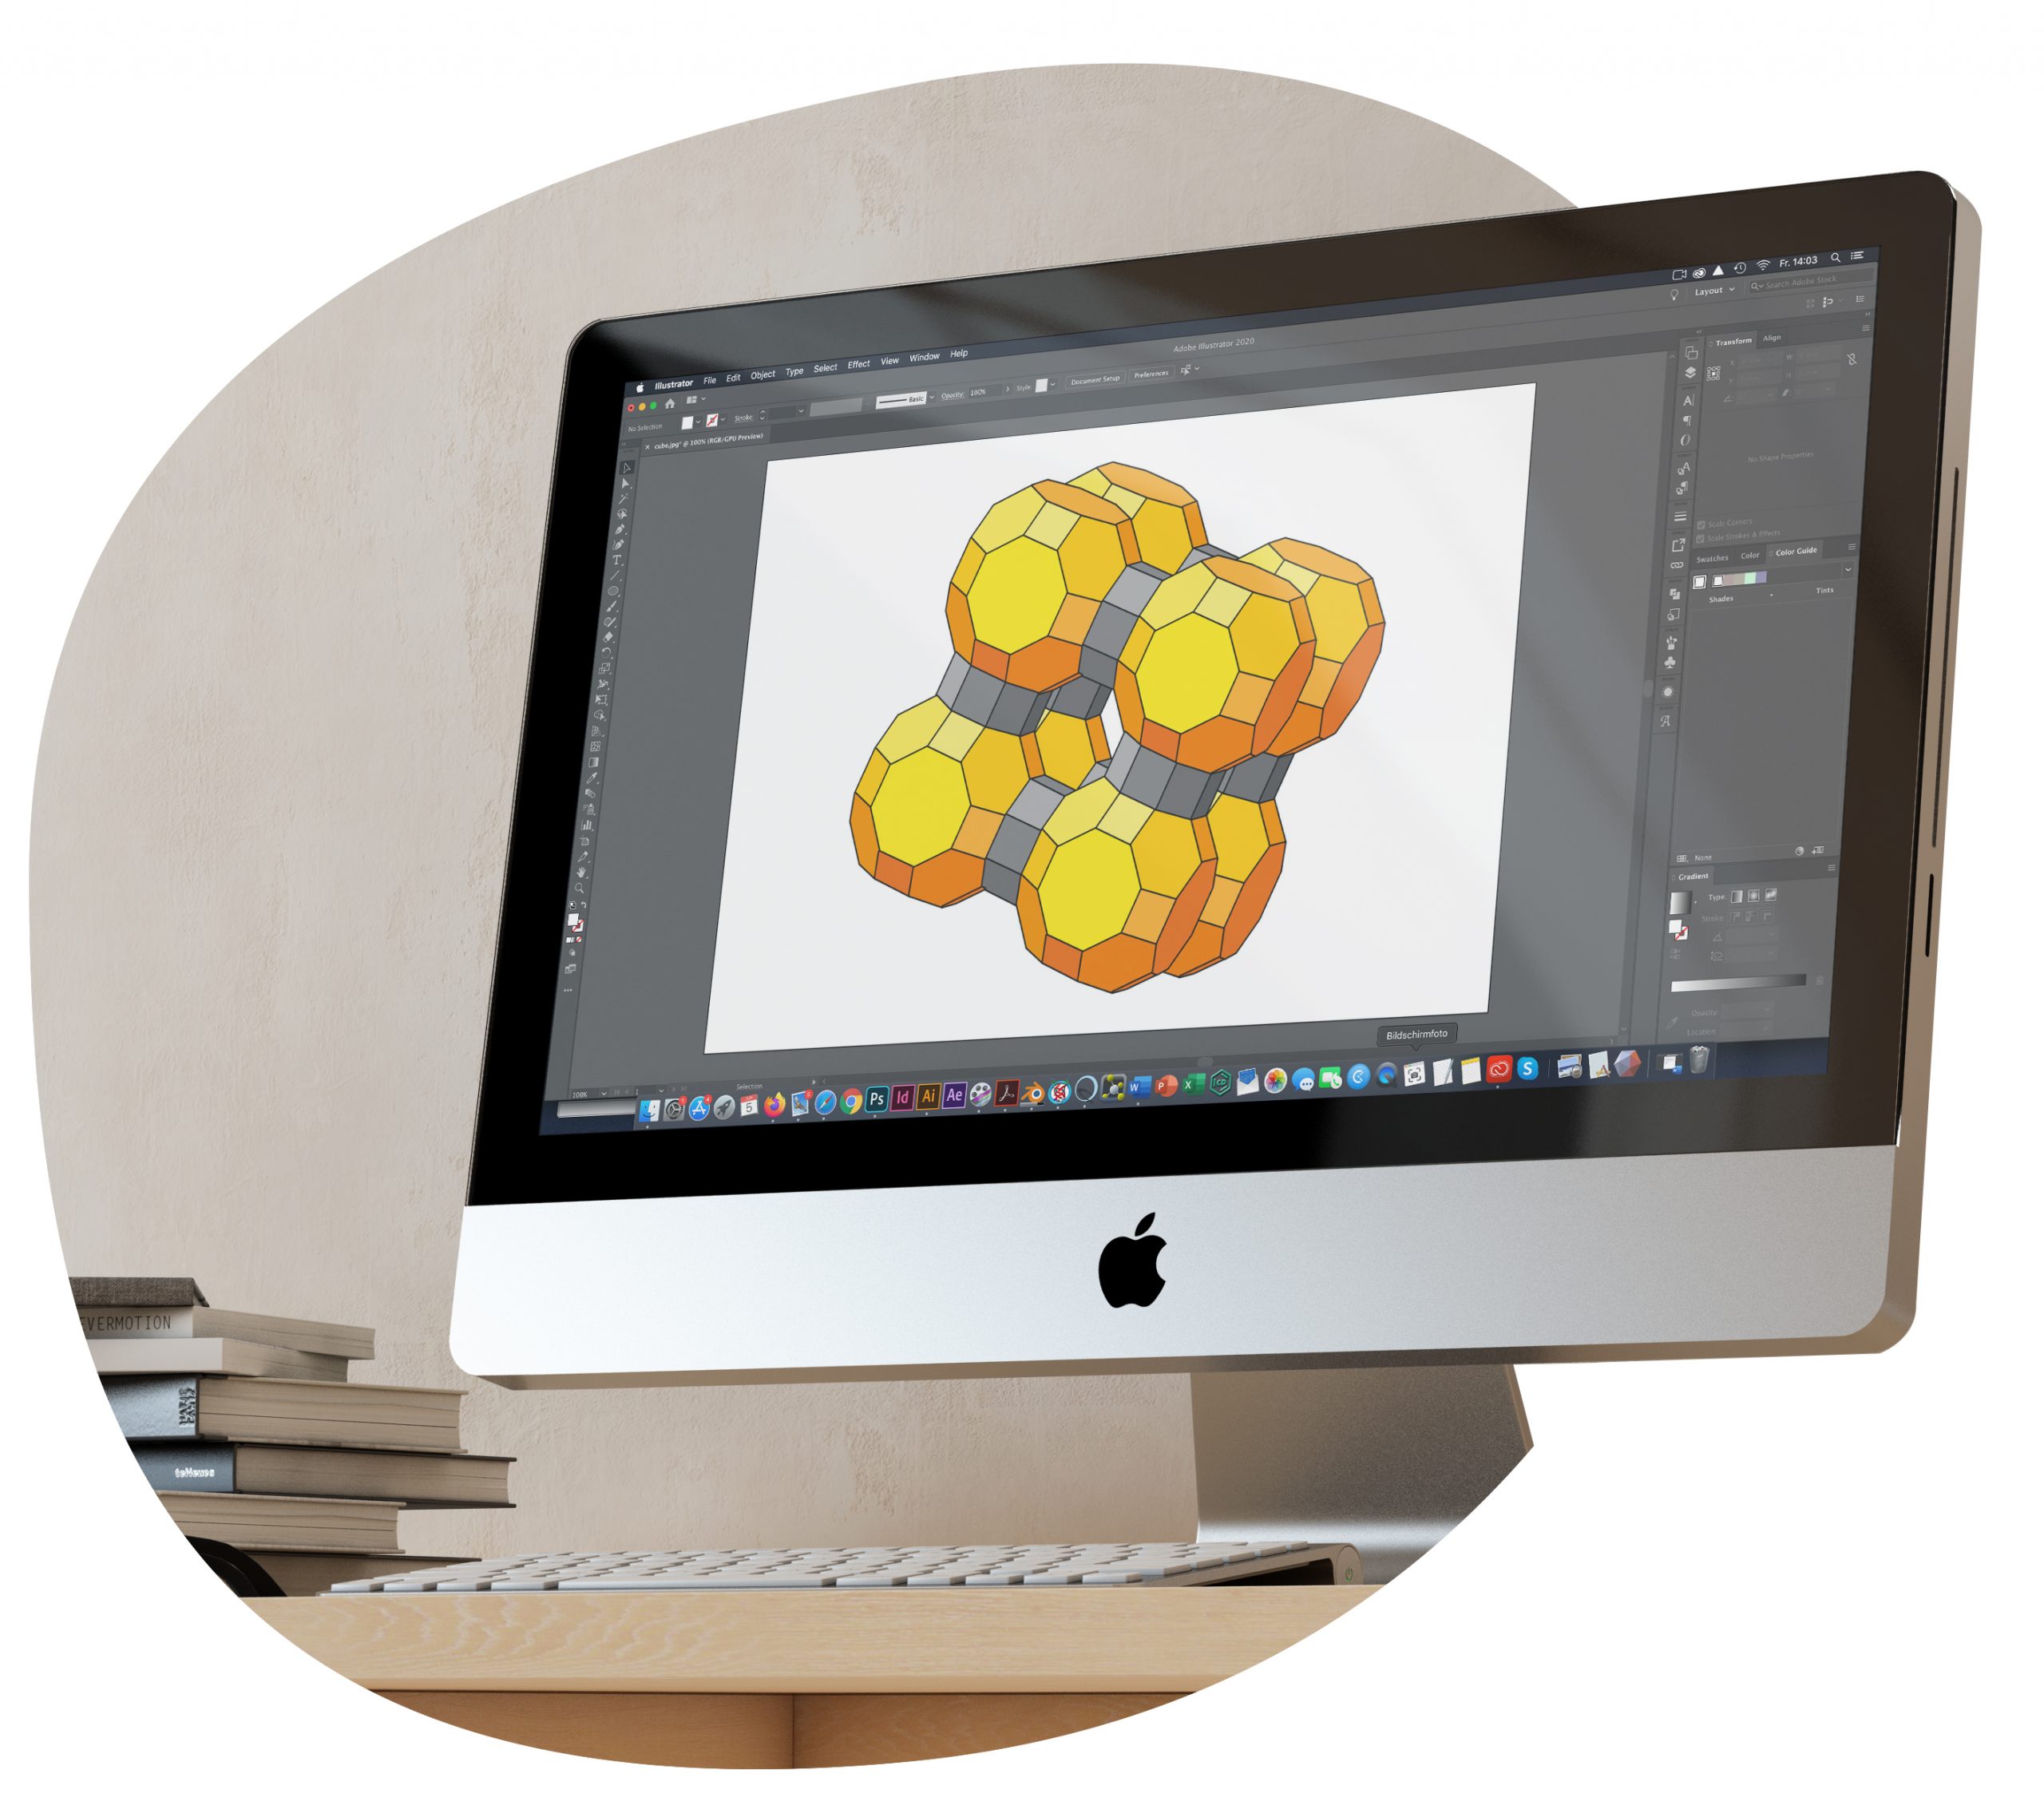
This section provides deep insight into the world of design software and software for data visualization. You will learn about the advantages and limitations of PowerPoint being the most widely used software and several alternatives. An insight into the Adobe Creative Suite bundle (the most widely used graphic design software) should highlight the possibilities that professional software offers in poster and presentation design.